Generative process#
Definitions#
We can generate participants’ biomarker data according to EBM (Event-Based Model).
\(S \sim {\rm UniformPermutation}(\cdot)\)
\(S\) follows a distribution of uniform permutation. That means the ordering of biomarkers is random.
\(k_j \sim {\rm DiscreteUniform}(N)\)
\(k_j\) follows a discrete uniform distribution, which means a participant is equally likely to fall in a progression stage (e.g., from \(0\) to \(4\), where \(0\) indicate this participant is healthy.)
Note that \(\sim\) in statistics indicates that this variable follows a certain distribution. Here, it means that the biomarker values is drawn from that distribution.
Parameters#
\(z_j\): \(1\) if the participant is diseased; otherwise \(0\).
\(I(True) = 1\), \(I(False) = 0\)
\(S\) denotes the ordering of a sequence of biomarkers.
\(N\): number of observed biomarkers.
\(n\): a specific biomarker; e.g., biomarker \(b\).
\(J\): number of participants.
\(j\) denotes a participant.
\(X\) is observed values of biomarkers; it is a matrix of dimension of \(N \times J\) or \(J \times N\).
\(k\): a scalar whose value is the participant’s stage of the disease
\(K\): number of disease stages
\(S(n)\) means the disease stage that a specific biomarker \(n\) indicates.
\(k_j\): disease stage that a participant is at.
\(X_{nj}\) means the observed value of the biomarker \(n\) in participant \(j\).
\(\theta_n\) is the parameters for the probability density function (PDF) of observed value of biomarker \(n\) when this biomarker has been affected by the disease. Let’s assume this distribution is a Gaussian distribution.
\(\phi_n\) is the parameters for the probability density function (PDF) of observed value of biomarker \(n\) when this biomarker has NOT been affected by the disease.
Simulation#
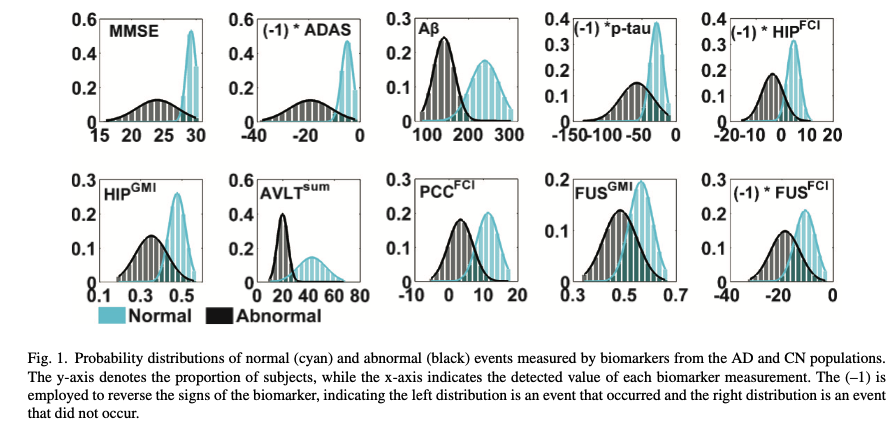
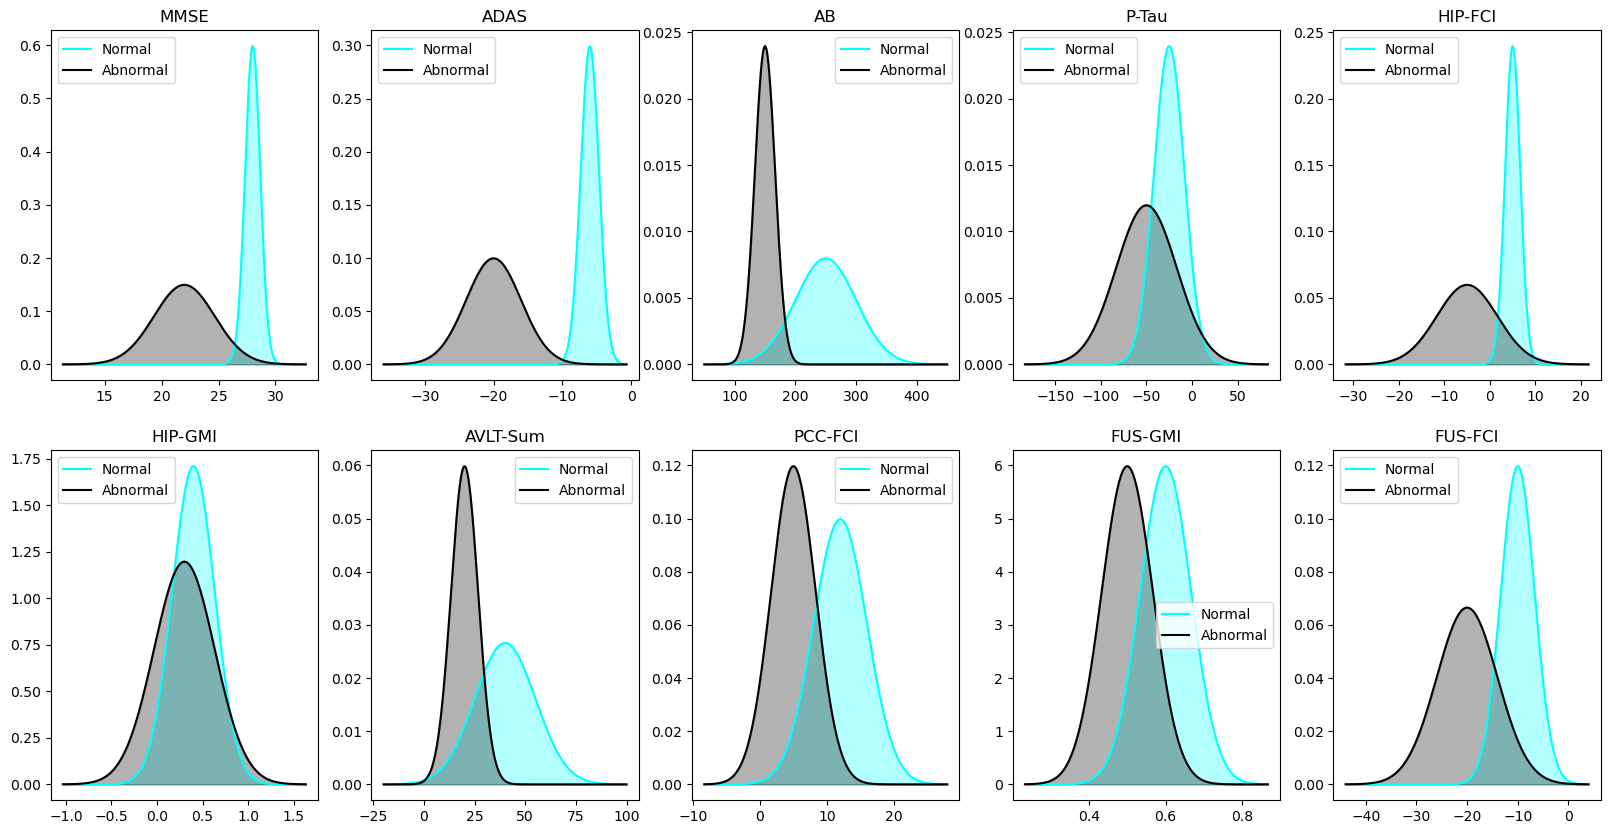
We are going to generate biomarker values for each participant by randomly drawing from distributions defined by \(\theta\) or \(\phi\). We will base our generation on Chen’s paper (Figure 1).

import numpy as np
import scipy.stats as stats
import altair as alt
import pandas as pd
import matplotlib.pyplot as plt
# S_ordering = [5, 6, 3, 4, 1, 7, 8, 2, 9, 10]
def get_zscore(arr):
    mu = np.mean(arr)
    std = np.std(arr)
    return (arr - mu)/std

def min_max_scale(arr):
    arr_min = np.min(arr)
    arr_max = np.max(arr)
    scaled_arr = (arr - arr_min) / (arr_max - arr_min)
    return scaled_arr
biomarker_names = np.array([
    'MMSE', 'ADAS', 'AB', 'P-Tau', 'HIP-FCI',
    'HIP-GMI', 'AVLT-Sum', 'PCC-FCI', 'FUS-GMI', 'FUS-FCI'])
biomarker_index_name_dict = dict(zip(range(10), biomarker_names))
S_ordering = np.array([
    'HIP-FCI', 'PCC-FCI', 'AB', 'P-Tau', 'MMSE', 'ADAS',
    'HIP-GMI', 'AVLT-Sum', 'FUS-GMI', 'FUS-FCI'
    ])
# biomarker_names
# cyan, normal
theta_means = [28, -6, 250, -25, 5, 0.4, 40, 12, 0.6, -10]
# black, abnormal
phi_means = [22, -20, 150, -50, -5, 0.3, 20, 5, 0.5, -20]
# cyan, normal
theta_std_times_three = [2, 4, 150, 50, 5, 0.7, 45, 12, 0.2, 10]
theta_stds = [std_dev/3 for std_dev in theta_std_times_three]
# black, abnormal
phi_std_times_three = [8, 12, 50, 100, 20, 1, 20, 10, 0.2, 18]
phi_stds = [std_dev/3 for std_dev in phi_std_times_three]

# """apply z score transformation"""
# theta_means = get_zscore(theta_means)
# phi_mean = get_zscore(phi_means)
# theta_stds = get_zscore(theta_stds)
# phi_stds = get_zscore(phi_stds)

# # Apply min-max scaling
# theta_means_scaled = min_max_scale(theta_means)
# phi_means_scaled = min_max_scale(phi_means)
# theta_stds_scaled = min_max_scale(theta_stds)
# phi_stds_scaled = min_max_scale(phi_stds)
biomarker_index_name_dict
{0: 'MMSE',
 1: 'ADAS',
 2: 'AB',
 3: 'P-Tau',
 4: 'HIP-FCI',
 5: 'HIP-GMI',
 6: 'AVLT-Sum',
 7: 'PCC-FCI',
 8: 'FUS-GMI',
 9: 'FUS-FCI'}
# theta_means = [1, 3, 5, 6, 8, 0, 4, 2, 7, 9]
# theta_stds = [0.3, 0.5, 0.2, 1.3, 3.3, 2.2, 0.8, 0.9, 0.7, 0.6]
# phi_means = [32, 31, 34, 36, 38, 39, 30, 33, 35, 37]
# phi_stds = [6.3, 7.4, 9.4, 4.9, 2.5, 5.9, 6.4, 7.7, 8.0, 3.0]
def plot_distribution_pair(ax, mu1, sigma1, mu2, sigma2, title):
    xmin = min(mu1 - 4*sigma1, mu2-4*sigma2)
    xmax = max(mu1 + 4*sigma1, mu2 + 4*sigma2)
    x = np.linspace(xmin, xmax, 1000)
    y1 = stats.norm.pdf(x, loc = mu1, scale = sigma1)
    y2 = stats.norm.pdf(x, loc = mu2, scale = sigma2)
    ax.plot(x, y1, label = "Normal", color = "cyan")
    ax.plot(x, y2, label = "Abnormal", color = "black")
    ax.fill_between(x, y1, alpha = 0.3, color = "cyan")
    ax.fill_between(x, y2, alpha = 0.3, color = "black")
    ax.set_title(title)
    ax.legend()

fig, axes = plt.subplots(2, 5, figsize=(20, 10))
for i, biomarker_name in enumerate(biomarker_names):
    ax = axes.flatten()[i]
    mu1 = theta_means[i]
    mu2 = phi_means[i]
    sigma1 = theta_stds[i]
    sigma2 = phi_stds[i]
    plot_distribution_pair(
        ax, mu1, sigma1, mu2, sigma2, title = biomarker_name)

for n, biomarker in enumerate(biomarker_names):
    print(n, biomarker)
0 MMSE
1 ADAS
2 AB
3 P-Tau
4 HIP-FCI
5 HIP-GMI
6 AVLT-Sum
7 PCC-FCI
8 FUS-GMI
9 FUS-FCI
def simulate_ebm(
        biomarker_names, S_ordering, J, theta_means, theta_std_dev, phi_means, phi_std_dev):
    """
    Simulate an Event-Based Model (EBM) for disease progression.

    Args:
    biomarker_names: Biomarker names
    S_ordering: Biomarker names ordered according to the order in which each of them get affected
    by the disease
    J (int): Number of participants.

    Returns:
    tuple: A tuple containing:
        - kjs (numpy.ndarray): The disease stages for participant.
        - X (numpy.ndarray): The biomarker matrix with participant data.
          - Each cell in X is tuple containing participantId, biomarker name, biomarker value,
            disease stage of this participant, disease stage current biomarker indicates
            and healthy status
    """
    # N (int): Number of biomarkers.
    N = len(biomarker_names)

    # Generate a random stage for each participant
    # The stage should be between 0 and N, inclusive
    # stage 0 indicate the participant is healthy (normal)
    kjs = np.random.randint(0, N+1, size=J)

    # Initiate biomarker measurement matrix (J participants x N biomarkers),
    # with entries as None
    X = np.full((J, N), None, dtype=object)

    # biomarker : normal distribution
    theta_dist = {biomarker: stats.norm(
        theta_means[n], theta_std_dev[n]) for n, biomarker in enumerate(biomarker_names)}
    phi_dist = {biomarker: stats.norm(
        phi_means[n], phi_std_dev[n]) for n, biomarker in enumerate(biomarker_names)}

    # Iterate through participants
    for j in range(J):
        # Iterate through biomarkers
        for n, biomarker in enumerate(biomarker_names):
            # Disease stage of the current participant
            k_j = kjs[j]
            # Disease stage indicated by the current biomarker
            # Note that biomarkers always indicate that the participant is diseased
            # Thus, S_n >= 1
            S_n = np.where(S_ordering == biomarker)[0][0] + 1

            # Assign biomarker values based on the participant's disease stage
            if k_j >= 1:
                if k_j >= S_n:
                    X[j, n] = (j, biomarker, theta_dist[biomarker].rvs(), k_j, S_n, 'affected')
                else:
                    X[j, n] = (j, biomarker, phi_dist[biomarker].rvs(), k_j, S_n, 'not_affected')
            # if the participant is healthy
            else:
                X[j, n] = (j, biomarker, phi_dist[biomarker].rvs(), k_j, S_n, 'not_affected')
    return kjs, X
J = 100
kjs, X = simulate_ebm(biomarker_names, S_ordering, J, theta_means, theta_stds, phi_means, phi_stds)
theta_means, theta_stds, phi_means, phi_stds
([28, -6, 250, -25, 5, 0.4, 40, 12, 0.6, -10],
 [0.6666666666666666,
  1.3333333333333333,
  50.0,
  16.666666666666668,
  1.6666666666666667,
  0.2333333333333333,
  15.0,
  4.0,
  0.06666666666666667,
  3.3333333333333335],
 [22, -20, 150, -50, -5, 0.3, 20, 5, 0.5, -20],
 [2.6666666666666665,
  4.0,
  16.666666666666668,
  33.333333333333336,
  6.666666666666667,
  0.3333333333333333,
  6.666666666666667,
  3.3333333333333335,
  0.06666666666666667,
  6.0])
df_means_stds = pd.DataFrame([theta_means, theta_stds, phi_means, phi_stds]).transpose()
df_means_stds.columns = ['theta_mean', 'theta_std', 'phi_mean', 'phi_std']
df_means_stds = df_means_stds.rename_axis("biomarker", axis=0).reset_index()
df_means_stds['biomarker'] = df_means_stds.apply(lambda row: biomarker_index_name_dict[row.biomarker], axis = 1)
df_means_stds
| biomarker | theta_mean | theta_std | phi_mean | phi_std | |
|---|---|---|---|---|---|
| 0 | MMSE | 28.0 | 0.666667 | 22.0 | 2.666667 |
| 1 | ADAS | -6.0 | 1.333333 | -20.0 | 4.000000 |
| 2 | AB | 250.0 | 50.000000 | 150.0 | 16.666667 |
| 3 | P-Tau | -25.0 | 16.666667 | -50.0 | 33.333333 |
| 4 | HIP-FCI | 5.0 | 1.666667 | -5.0 | 6.666667 |
| 5 | HIP-GMI | 0.4 | 0.233333 | 0.3 | 0.333333 |
| 6 | AVLT-Sum | 40.0 | 15.000000 | 20.0 | 6.666667 |
| 7 | PCC-FCI | 12.0 | 4.000000 | 5.0 | 3.333333 |
| 8 | FUS-GMI | 0.6 | 0.066667 | 0.5 | 0.066667 |
| 9 | FUS-FCI | -10.0 | 3.333333 | -20.0 | 6.000000 |
df_means_stds.to_csv('data/means_stds.csv', index=False)
X[10]
array([(10, 'MMSE', 26.616605393495316, 8, 5, 'affected'),
       (10, 'ADAS', -7.3556255818332055, 8, 6, 'affected'),
       (10, 'AB', 275.844520945162, 8, 3, 'affected'),
       (10, 'P-Tau', -56.84913883593285, 8, 4, 'affected'),
       (10, 'HIP-FCI', 7.611674349923921, 8, 1, 'affected'),
       (10, 'HIP-GMI', 0.5216743457543183, 8, 7, 'affected'),
       (10, 'AVLT-Sum', 41.68089096959266, 8, 8, 'affected'),
       (10, 'PCC-FCI', 15.028459059046519, 8, 2, 'affected'),
       (10, 'FUS-GMI', 0.487738269498379, 8, 9, 'not_affected'),
       (10, 'FUS-FCI', -20.445112160069744, 8, 10, 'not_affected')],
      dtype=object)
Please note that “not_affected” and “affected” are refering to a specific biomarker, rather than this participant’s healthy status.
df = pd.DataFrame(X, columns=biomarker_names)
df
# make this dataframe wide to long
df_long = df.melt(var_name = "Biomarker", value_name="Value")
df_long
values_df = df_long['Value'].apply(pd.Series)
values_df.columns = ['participant', "biomarker", 'measurement', 'k_j', 'S_n', 'affected_or_not']
values_df
| participant | biomarker | measurement | k_j | S_n | affected_or_not | |
|---|---|---|---|---|---|---|
| 0 | 0 | MMSE | 28.812457 | 5 | 5 | affected |
| 1 | 1 | MMSE | 28.483480 | 8 | 5 | affected |
| 2 | 2 | MMSE | 27.483507 | 5 | 5 | affected |
| 3 | 3 | MMSE | 27.886646 | 9 | 5 | affected |
| 4 | 4 | MMSE | 27.412189 | 8 | 5 | affected |
| ... | ... | ... | ... | ... | ... | ... |
| 995 | 95 | FUS-FCI | -21.983887 | 1 | 10 | not_affected |
| 996 | 96 | FUS-FCI | -16.649357 | 1 | 10 | not_affected |
| 997 | 97 | FUS-FCI | -19.670933 | 5 | 10 | not_affected |
| 998 | 98 | FUS-FCI | -18.132486 | 0 | 10 | not_affected |
| 999 | 99 | FUS-FCI | -18.226765 | 1 | 10 | not_affected |
1000 rows × 6 columns
Visualizing simulated results#
With the above data structure, we can visualize the following data:
Distribution of all biomarker values by biomarker
Distribution of all biomarker values when the participant is at a certain disease stage
Comparing a certain biomarker data
A certain participant’s data
Distribution of all biomarker values by biomarker#
df = pd.DataFrame(X, columns=biomarker_names)
# make this dataframe wide to long
df_long = df.melt(var_name = "Biomarker", value_name="Value")
values_df = df_long['Value'].apply(pd.Series)
values_df.columns = ['participant', "biomarker", 'measurement', 'k_j', 'S_n', 'affected_or_not']
df = values_df

alt.Chart(df).transform_density(
    'measurement',
    as_=['measurement', 'Density'],
    groupby=['biomarker']
).mark_area().encode(
    x="measurement:Q",
    y="Density:Q",
    facet = alt.Facet(
        "biomarker:N",
        columns = 5
    ),
    color=alt.Color(
        'biomarker:N'
    )
).properties(
    width= 140,
    height = 200,
).properties(
    title='Biomarker data for all participants across all stages'
)
df.to_csv("data/participant_data.csv", index=False)
df.head()
| participant | biomarker | measurement | k_j | S_n | affected_or_not | |
|---|---|---|---|---|---|---|
| 0 | 0 | MMSE | 28.812457 | 5 | 5 | affected |
| 1 | 1 | MMSE | 28.483480 | 8 | 5 | affected |
| 2 | 2 | MMSE | 27.483507 | 5 | 5 | affected |
| 3 | 3 | MMSE | 27.886646 | 9 | 5 | affected |
| 4 | 4 | MMSE | 27.412189 | 8 | 5 | affected |
# df[df.k_j == 0]
Distribution of all biomarker values when the participant is at a certain disease stage#
# biomarker data when the participant is at stage 6
df_kj_6 = df[df.k_j == 6]
df_kj_6

alt.Chart(df_kj_6).transform_density(
    'measurement',
    as_=['measurement', 'Density'],
    groupby=['biomarker']
).mark_area().encode(
    x="measurement:Q",
    y="Density:Q",
    facet = alt.Facet(
        "biomarker:N",
        columns = 5
    ),
    color=alt.Color(
        'biomarker:N'
    )
).properties(
    width= 140,
    height = 200,
).properties(
    title='Biomarker data when the participant is at stage six'
)
Comparing a certain biomarker data#
# select only biomarker 2
bio_2_data = df[df.biomarker=='MMSE'].drop(['k_j', 'S_n', 'biomarker'], axis = 1)
# biomarker2 data, comparing from diseased and healthy groups
alt.Chart(bio_2_data).transform_density(
    'measurement',
    as_=['measurement', 'Density'],
    groupby=['affected_or_not']
).mark_area().encode(
    x="measurement:Q",
    y="Density:Q",
    facet = alt.Facet(
        "affected_or_not:N",
    ),
    color=alt.Color(
        'affected_or_not:N'
    )
).properties(
    width= 240,
    height = 200,
).properties(
    title='MMSE data, compring healthy group and diseased group'
)
A certain participant’s data#
# participant 10
participant10_data = df[df.participant == 10]
alt.Chart(participant10_data).mark_bar().encode(
    x='biomarker',
    y='measurement',
    color=alt.Color(
        'affected_or_not:N'
    ),
    tooltip=['biomarker', 'affected_or_not', 'measurement']
).interactive().properties(
    title=f'Biomarker data for participant 10 (k_j = {participant10_data.k_j.to_list()[0]})'
)
